Data Explorer
Overview
The Data Explorer is an in-browser analysis workspace that lets you load trial data from one or more of your studies and explore it interactively — with a no-code visual builder, SQL, or (on Pro) Python and R notebooks. Data is loaded into a DuckDB database that runs entirely inside your browser, so the trial events you load stay private on your own device.
Open the Data Explorer from the Data Explorer link in the dashboard sidebar, or by navigating to https://research.open-lab.online/dashboard/analysis. The first time you open it, a short welcome tour walks you through loading data, exploring it, and (for Pro users) analysing it in notebooks. You can skip or dismiss the tour at any time.
The Explorer complements the per-study Data Analysis page: use Data Analysis to monitor a single study, decrypt data, and download raw or formatted exports (CSV, JSON, Excel, SPSS, PDF); use the Data Explorer to combine data across studies and query it interactively. Query results in the Explorer can also be downloaded as CSV.
Loading study data
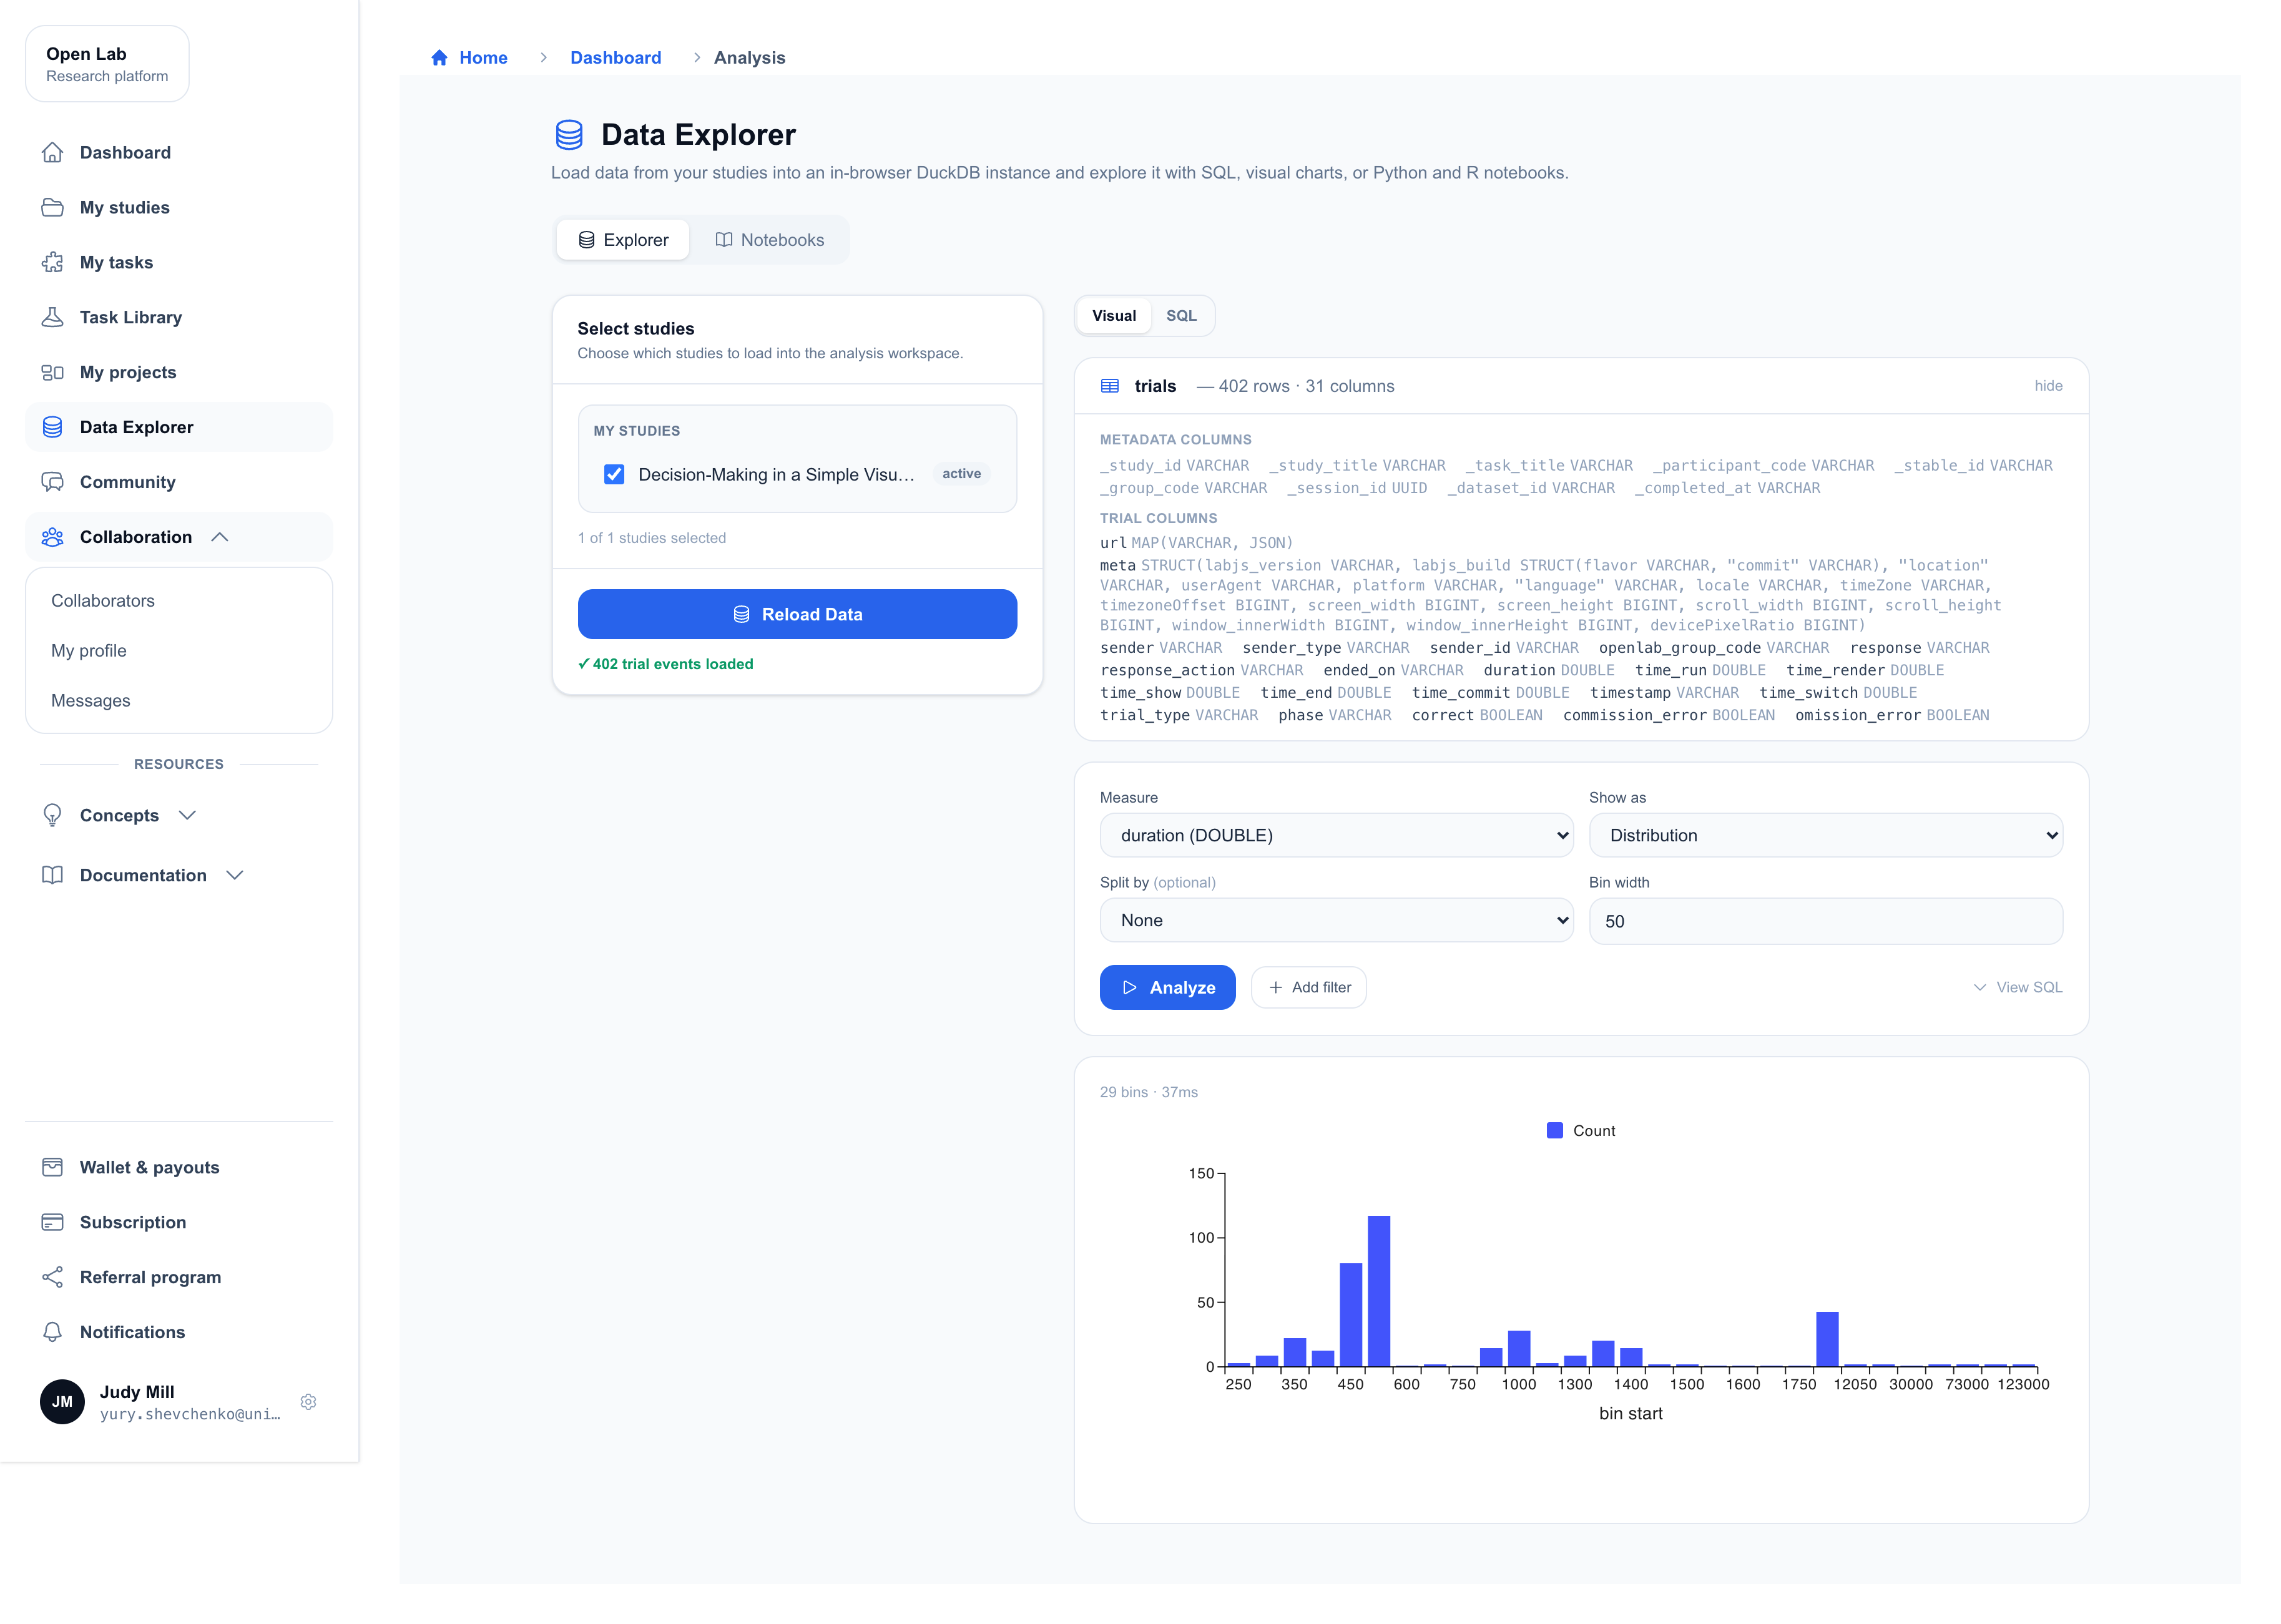
The Explorer opens on the Explorer tab. In the Select studies panel on the left, choose which studies to load — both studies you own and studies shared with you through projects are listed. Select one or more studies, then click Load Data. A progress bar shows the datasets being fetched and loaded; when it finishes you'll see a confirmation such as “✓ 2,340 trial events loaded”. Click Reload Data at any time to refresh or change your selection.
Every trial event across the selected studies is combined into a single table called trials. Alongside the columns recorded in your task, the table includes metadata columns (shown with a leading underscore, e.g. _participant_code) that let you group and filter by participant or session.
A few things to be aware of when loading data:
- Encrypted datasets are skipped. The Explorer only loads final, non-encrypted datasets. If a study contains encrypted data, a notice tells you how many datasets were skipped — decrypt them from the study's Data Analysis view to include them.
- Row limits depend on your plan. Free accounts can preview up to 1,000 trial events and Basic up to 5,000; Pro loads the full dataset. When a preview is capped, a notice shows the limit and a prompt to upgrade.
The visual builder
Once data is loaded, the workspace opens in Visual mode — a no-code way to summarise and chart your data. A collapsible schema panel above the builder lists the trials table's columns and their types so you always know what's available. Build an analysis by choosing:
- Measure: the column you want to analyse.
- Show as: how to summarise it. For numeric columns you can choose Distribution, Mean, Median, Count, Sum, StdDev, Min, or Max; for text/categorical columns the summary is a Count of each value.
- Split by (optional): a second column to break the results down by — for example mean reaction time split by condition.
- Bin width: when showing the distribution of a numeric measure, sets the size of each histogram bin.
Use Add filter to restrict the data: pick a column and tick the values you want to keep (each value shows how many rows it covers, with Select all and Clear shortcuts). Click Analyze to run it. Results are rendered as a chart appropriate to the query — a histogram, a bar chart across groups, or a single summary value. If you'd like to see the query behind a chart, click View SQL to reveal the generated SQL, which is a handy way to learn SQL from your own analyses.
Writing SQL directly
Switch the workspace to SQL mode to write queries against the trials table yourself. The SQL editor supports Ctrl/Cmd + Enter to run, and you can click any column name in the schema panel to insert it at the cursor. A set of example query buttons — such as Preview, Senders, Mean RT by sender, Accuracy by participant, and RT histogram — give you ready-made starting points (only the examples whose columns exist in your data are shown).
Click Run Query to see the results in a table (the first 500 rows are displayed, along with the row count and how long the query took). Use Download CSV to export the full result set, or open Build a chart to plot the results as a Bar, Line, or Scatter chart by choosing the X and Y columns.
Notebooks (Python & R)
The Notebooks tab, available on the Pro plan, lets you run deeper analyses in Python or R, right in the browser. Create a notebook, start from a ready-made template, and use the snippets sidebar to insert common operations. SQL cells inside a notebook can query the same data you loaded on the Explorer tab, so you can mix SQL, code, and charts in one place. If you haven't loaded any data yet, a reminder points you back to the Explorer tab.
Next Steps
Explore the following sections to work with your data or continue setting up your studies on the Open Lab platform:
Data
- Data Analysis: Monitor a single study, decrypt data, and download raw or formatted exports.
Study Setup
- Study Management: Learn how to create, edit, and publish studies.